
Week 40: Finviz Map, Pessimism Is Expensive, Supply & Demand of Stocks
Briefing:
- Based on its popularity, we are highlighting FinViz this week as a very useful tool for investor education.
- Skepticism is a really expensive habit and investors should do their best to avoid being skeptics of the space industry.
- Over the past 40 years, public companies purchased 8x more equity through M&A and buybacks than they have sold through IPOs or secondaries.
Finviz: Performance and relative company sizes
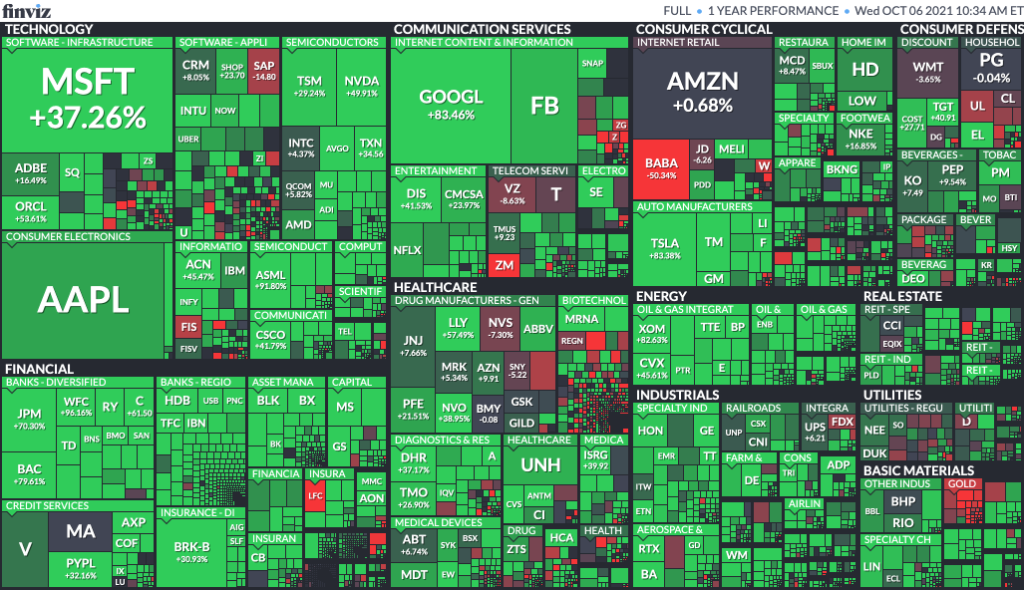
Finviz is a popular market data tool among the financial and investment community. Above is a map of the last 12 months of performance among global stocks that trade in US markets. The size of the square represents the size of the company. For example, Apple (AAPL) is larger than all global major banks combined: JPM, BAC, WFC, etc. This size difference is not always obvious on CNBC – Jamie Dimon gets far more airtime than Tim Cook, for example.
On certain days it can be interesting to watch entire sectors grow in value while others shrink. On other days you might have scattered red and green all over the map. When liquidity leaves the market, you will see the entire map as a big red block, and vice versa.
This dashboard is a helpful way to get to know who the dominant players are in each market and industry sector. Notable leaders are: ASML – #1 in the semiconductor equipment sector, MRNA Moderna – #1 in Biotech as of this year, ACN Accenture – #1 in technology services, and CRM Salesforce – #1 in the software category. For all investors, it’s important to know which top players are leading the pack and which newcomers are likely to dominate in their respective fields in the coming years. Many companies span across sectors, so I wouldn’t take these classifications as gospel. Consider where the growth is likely to come from for the next 1, 3 and 5 years. You may even discover new ways to be highly optimistic about the future in the process.
You can play around with the timeframes and parameters to see different views of the global equities markets: FinViz.com.
Skepticism Is Expensive – the Instagram ‘bubble’ of 2012 and comparisons today
The Pessimist Archive recently shared a great John Stewart video from 2012 about the $1 billion acquisition of the “free photo-sharing app” by Facebook. At the time it was considered an outrage and a worrying sign of a bubble. Today Instagram is worth somewhere around $600 billion, more than Facebook’s own namesake website. It may be the most successful M&A result in history with a whopping 600x return over 9 years at scale.
The Pessimist Archive serves as a helpful reminder that while skepticism may feel more intellectually honest – and sometimes intellectually seductive – it has turned out to be a really expensive habit.
Space is one emergent trend that tends to attract understandable skepticism. Most investors tend to intuitively follow the golden Peter Lynch rule to “invest in what you know.” If that’s the case, then it’s probably as good a time as ever for investors to get more educated on space technology trends.
Rocket manufacturing pioneer Jim Cantrell has pointed out that technology improves dramatically and prices fall when we commit to manufacturing at scale. That scale is just starting to happen now as rocket production ramps up and established companies make public space-related commitments. Honda recently announced plans to manufacture reusable rockets to launch satellites by 2030.
As an exercise, let’s take a look at reusable rockets. The satellite industry’s revenue is growing somewhere between 20-30% per year and is expected to be a $50 billion market by 2025. Satellites provide essential infrastructure in our ultra-connected world. In this case, reusable rockets are a great way to save money on satellite launches. Imagine living in a world with single-use cars that explode after they return to your garage. Each trip would cost $30,000 instead of just the $20 in gas.
The closer you look into the space industry, the less it looks like a billionaire’s hobby (as stated skeptically in the media) and the more it looks like a major leap forward for data and communications systems. If we have these rockets already, they can be used by people as well. A good comparison to space travel might be the Amtrak railroads today. The train tracks between Boston and New York are 85% used by freight and only 15% used by passengers. Once we have regular rocket launches, perhaps 15% of that volume will be used for space tourism as well.
Equity Markets Supply & Demand
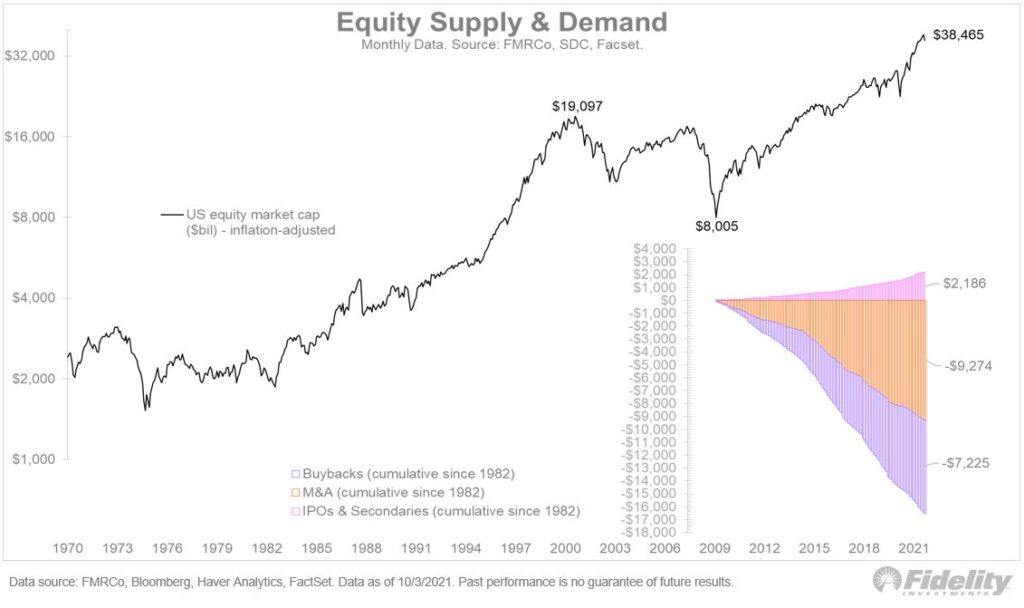
Jurrien Timmer (Fidelity Global Macro and all-around expert market data curator) recently pointed out that since 1984, IPO and Secondaries markets have sold (supply) $2.186 trillion of equity to market participants. Over that same period, existing public companies have purchased (demand) a whopping $7.225 trillion in share buybacks and $9.274 trillion in M&A activity. For a fascinating breakdown of the history of M&A at the major tech companies, take a look at this comprehensive analysis of the hundreds of acquisitions that helped Apple, Amazon, Facebook and Google get to where they are today.
Many investors today complain about the lack of profit-sharing for shareholders – mainly they are referring to a frustration of the lack of dividend income. Today’s investors seem to have a bit of an outdated habit of, “don’t touch your principal and aim to live off of the dividends.” The problem is, dividends are not where corporate profits are going as evidenced by the chart above. Too often we see the dividend yield of the S&P 500 quoted somewhere around 1.2% when the total yield with buybacks is closer to 2.25% and sometimes higher. That’s a big difference that gets largely ignored. Buybacks are dramatically more tax-efficient than dividends, but they are often politicized and tend to be a much harder concept for the average investor to understand. The financial media is not helping in this case either.
If you compare the supply side with the demand side, public companies have been net buyers of equity by a factor of 8x over the past 40 years. 8x refers to $2.186 trillion in equity value sold by companies vs $16.5 trillion in equity value purchased. This is a great explanation of why markets are at all time highs today and why the bull market can continue as these companies continue to confidently reinvest in their future and the equity that’s tied to it.
Weekly Articles by Osbon Capital Management:
"*" indicates required fields